Infographic & Data Visualization
ILLUSTRATION
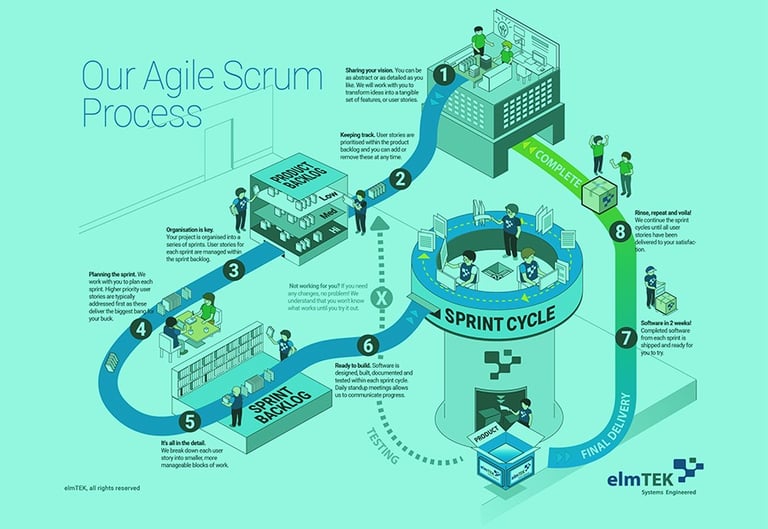
Infographics and data visualizations turn complex information into visually engaging and easy-to-understand graphics. By combining design and data, they help communicate key messages effectively, making information more accessible and impactful.


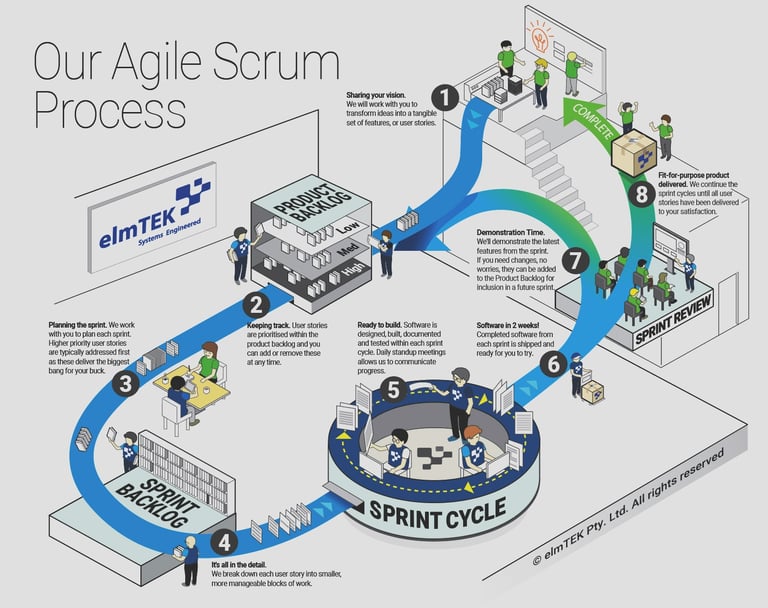
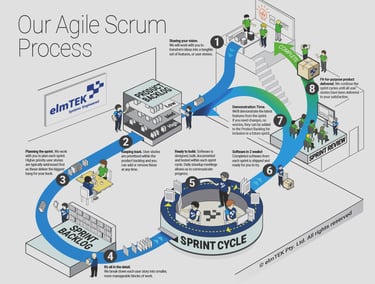
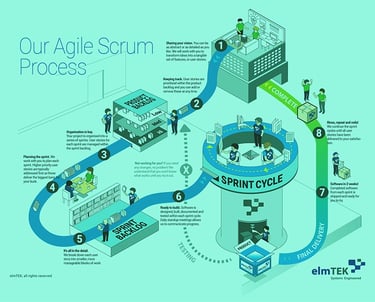
"Our Agile Scrum Process" visually represents the workflow of a system development company, outlining each phase from planning to delivery. Designed for clarity, this infographic helps teams and stakeholders easily understand the iterative and collaborative nature of Agile Scrum methodology.
Defense Strategy Simulation Concept Digital Art
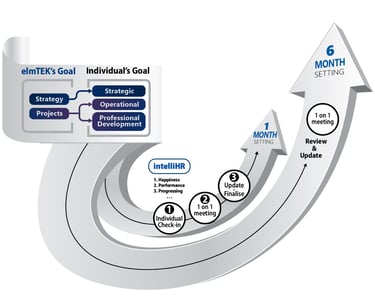
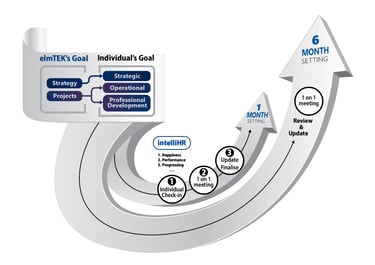
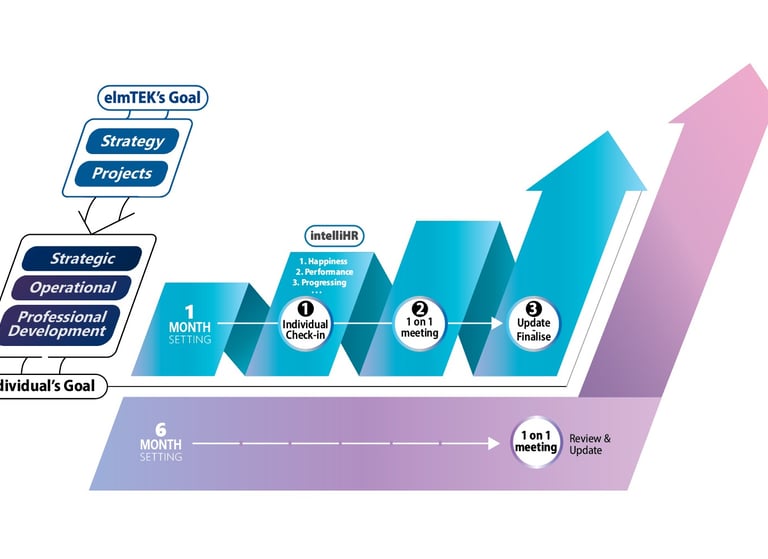
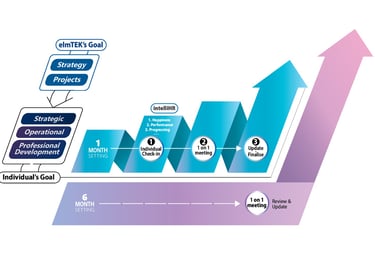
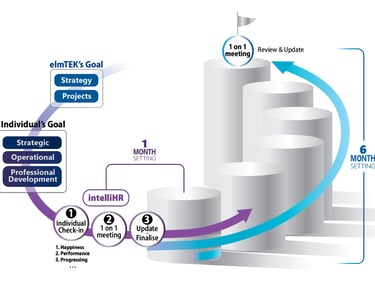
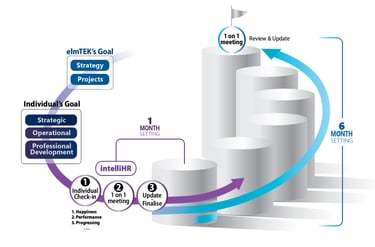
Complex annual plans, strategies, and workflows are transformed into clear, single-page visualizations. These designs simplify internal understanding and help external audiences grasp key processes at a glance.
Transforming Complex Data into Clear Insights